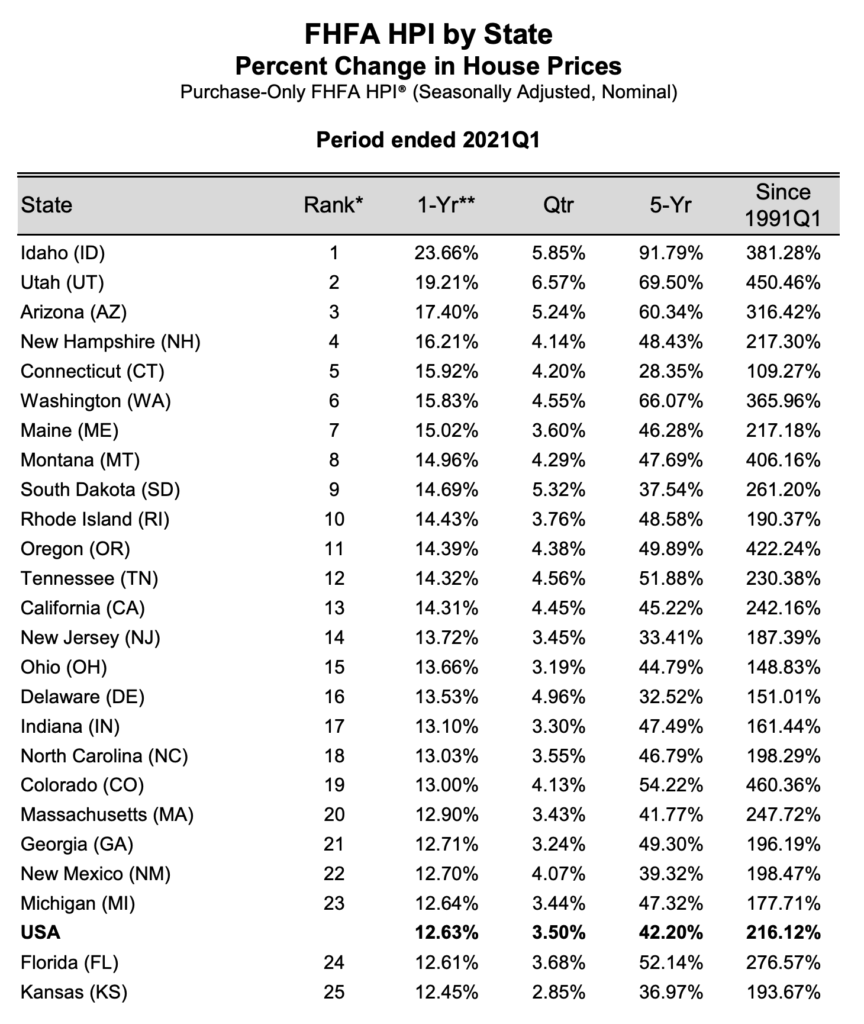
If we look at the big picture, median home price, nationally, is up 12.6%, in the 2nd quarter of 2021 (year over year). This is the 14th consecutive quarterly increase in median price and the highest quarterly gain in several decades. All 50 states, including the District of Columbia, had positive gains.
The top three gains, in the US, were experienced in the Mountain Region by Idaho, Utah & Arizona with about a 20% average gain.
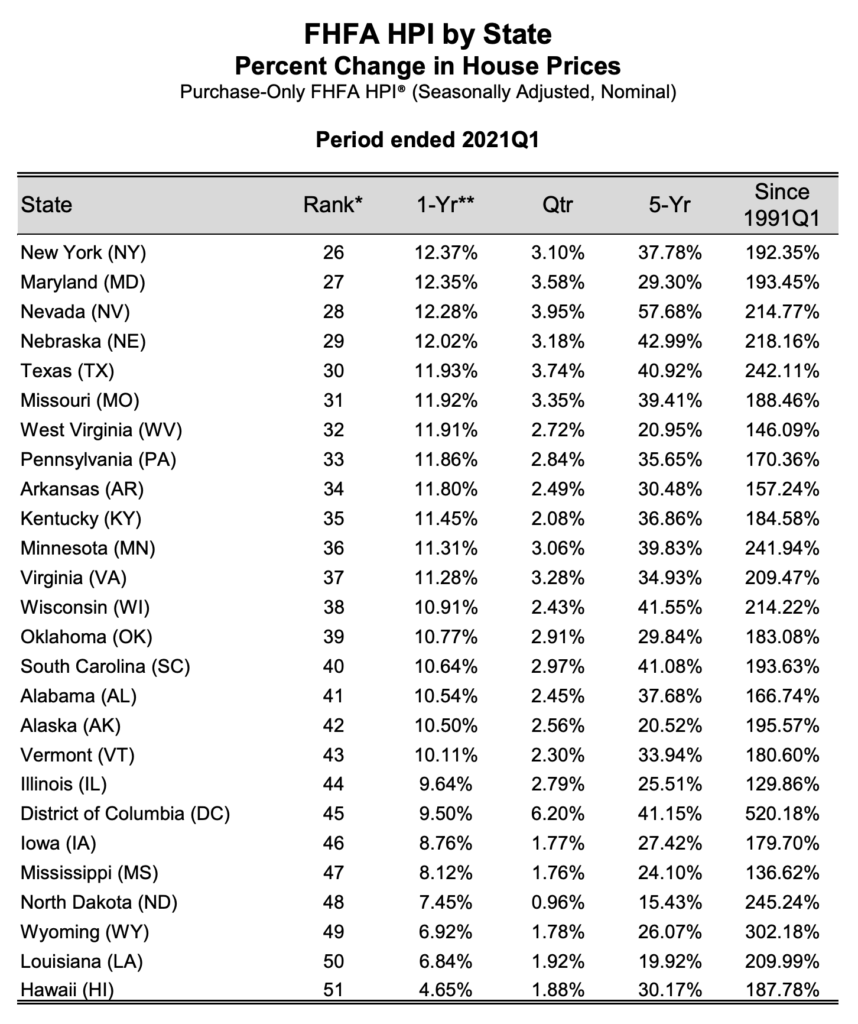
The state of Hawaii came in last, for price appreciation, with an increase of 4.65%, on average.
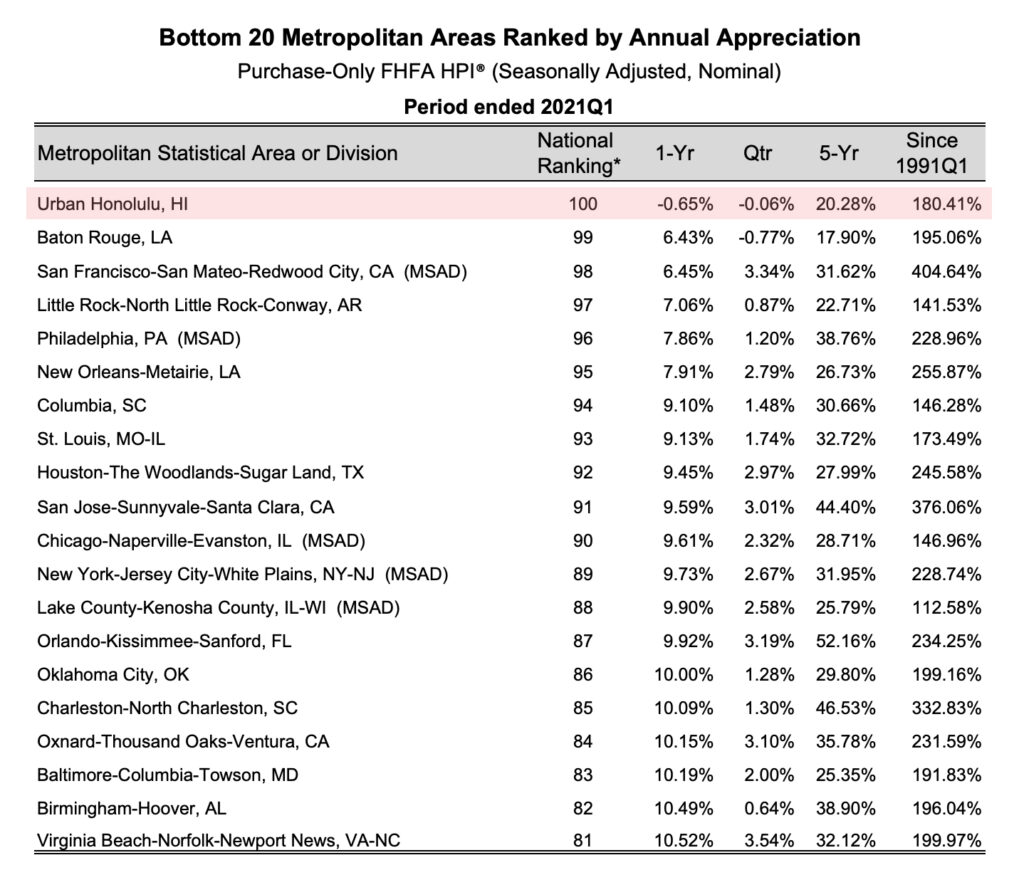
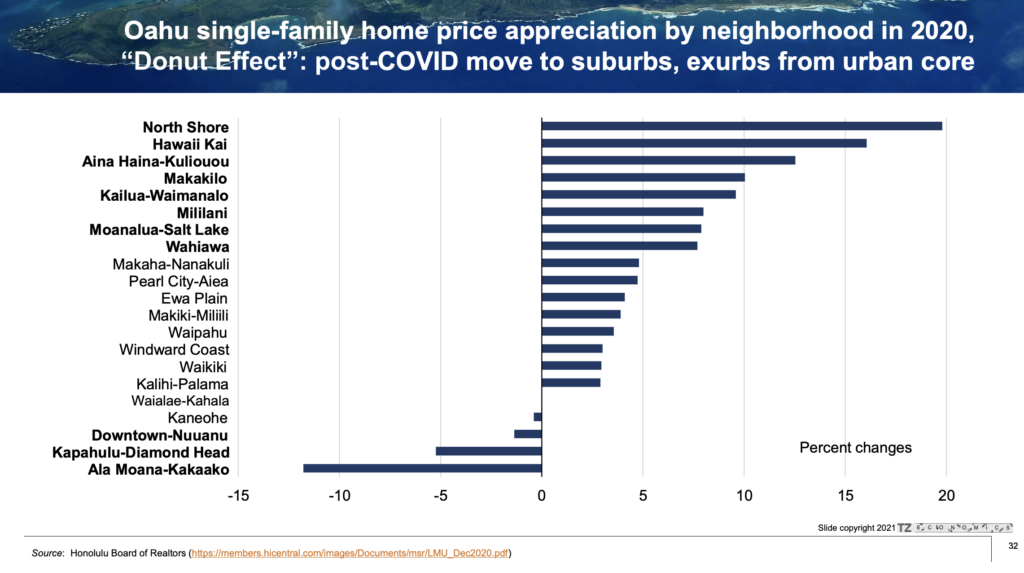
The City and County of Honolulu, on average, was down .65% and is 100th in the country for price appreciation. This low number is probably due to the large concentration of condos in the urban core of Honolulu and the “Doughnut Effect.”
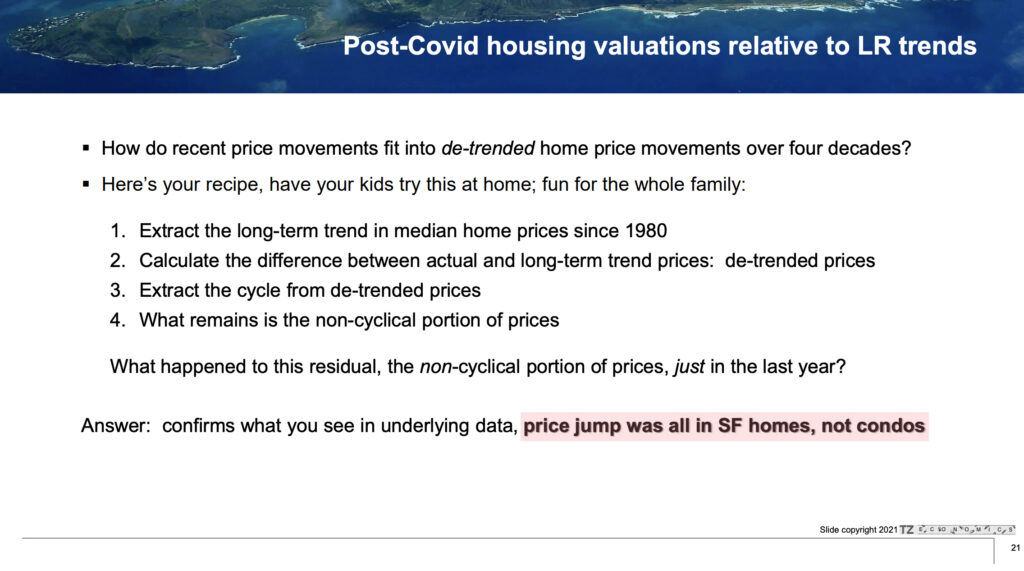
Paul Brewbaker (local economist), says the “price jump was all in SF homes, not condos”
This chart demonstrates the “Donut Effect,” and how price appreciation was experienced most greatly in the neighborhoods outside of the urban core. For example, “the suburbs, exurbs and zoom towns”
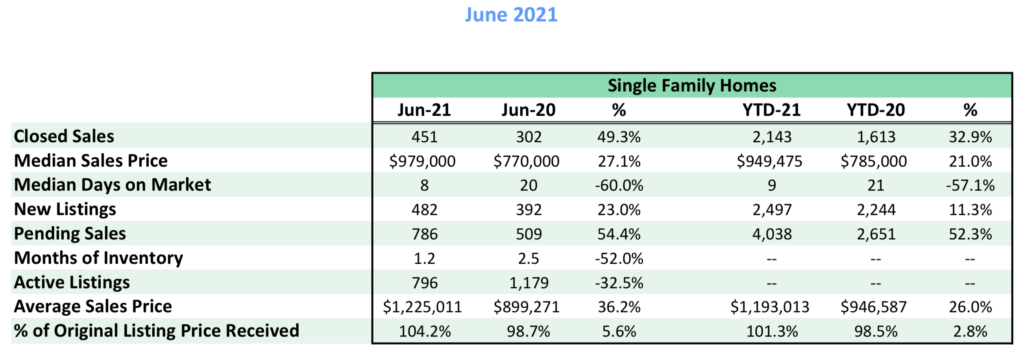
The above chart shows Hawaii Kai’s numbers for June 2021. You can clearly see the “Donut Effect” occurring, with a 33% increase in closings, 57% decrease in days on market and a median price increase of 21%.
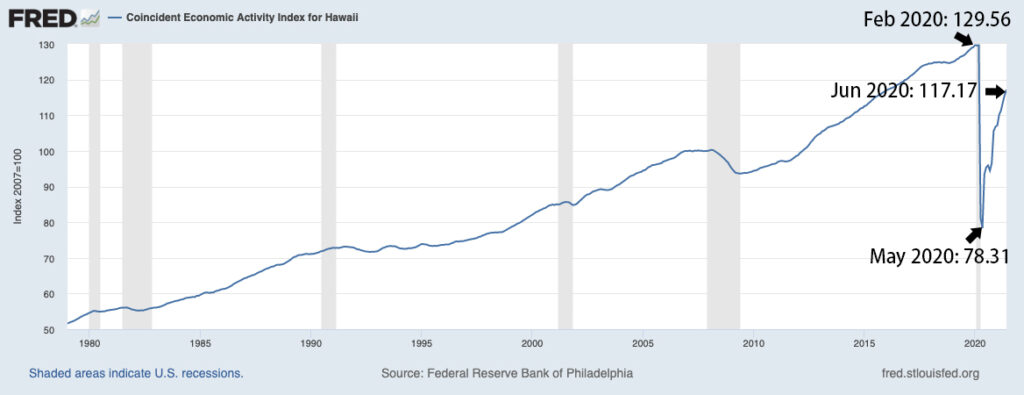
Hawaii’s Economic Activity Index has recovered from the lows of 78.31 points in May 2020, to 117.17. This 2nd quarter number is off just ~10% of Hawaii’s all time high, peak of 129.56 in Feb, 2020.
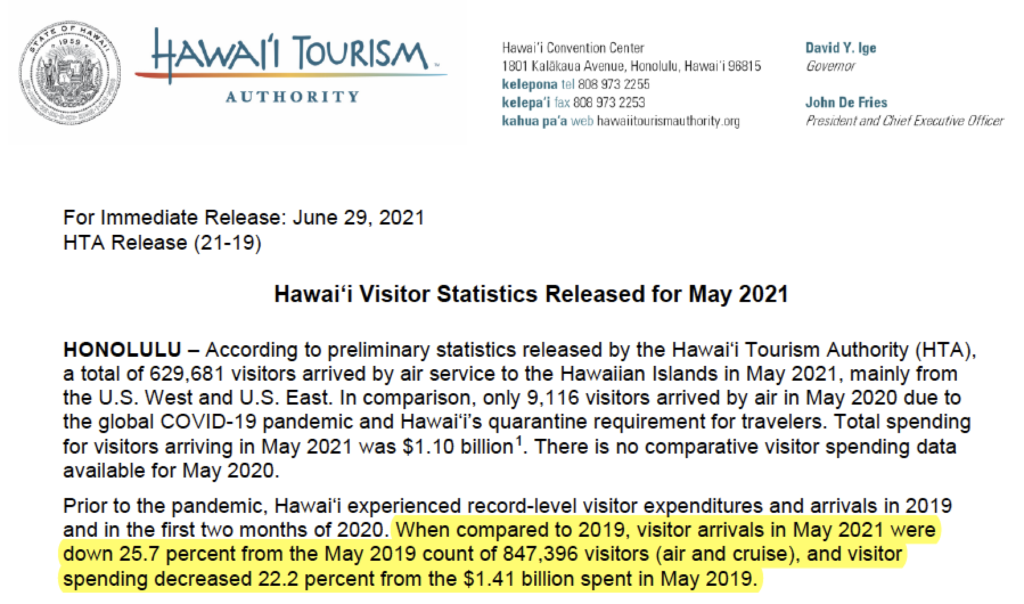
Arrivals and spending, in May 2020, were back with in 26% and 22%, respectively, of the record-level state highs in May 2019.
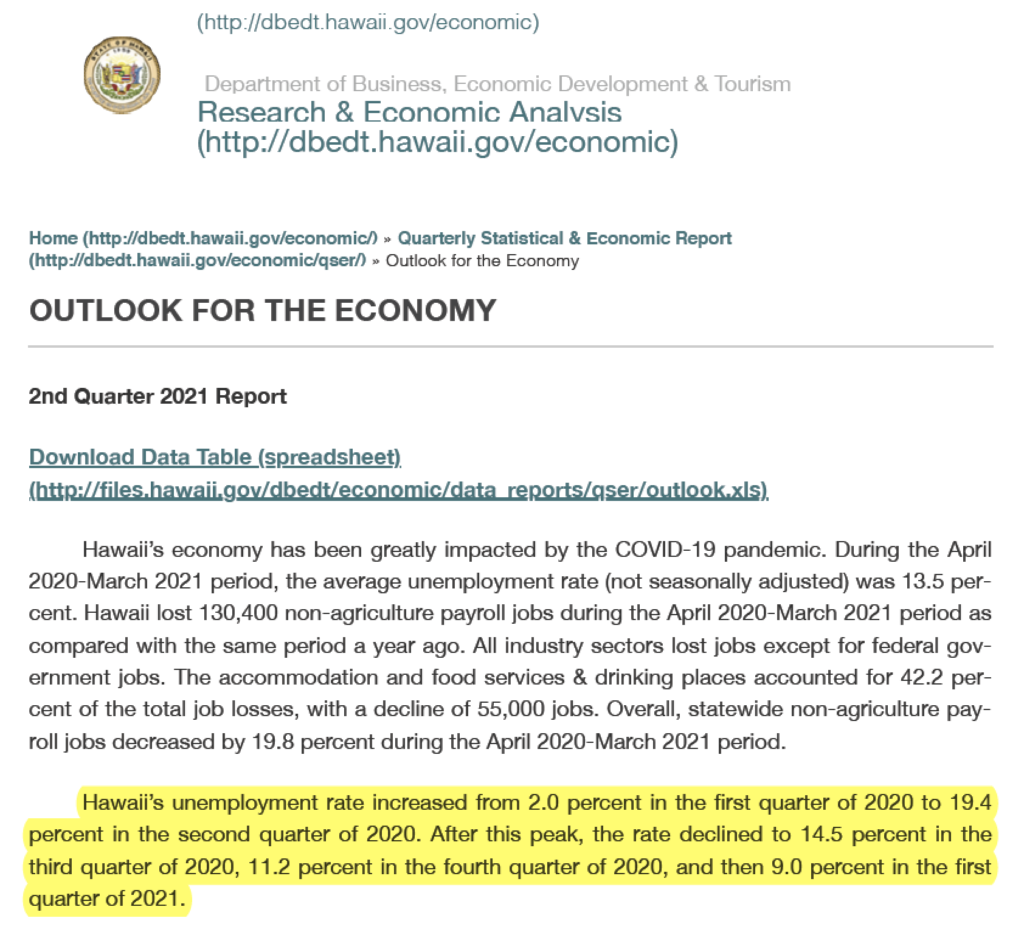
We can see unemployment numbers are consistently dropping from the highs of 19.4% in 2nd quarter, 2020 to 9% down in 1st quarter, 2021.
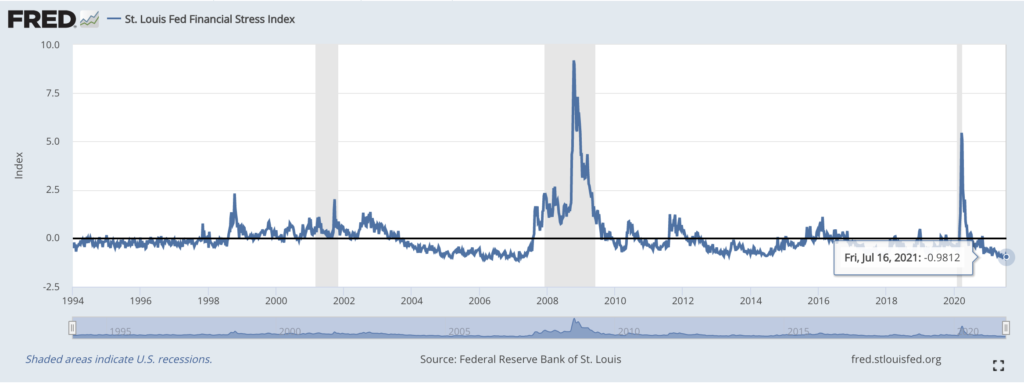
The financial stress index is at -.98 points, which is much better than the highs we saw at 5 points, back in March, 2020. And 9 points in 2008’s financial collapse.
The charts below are based upon the past 2 years of data for all Hawaii Kai Marina Front
Odds of selling
increase 24% in odds of selling & doubled units/month sold
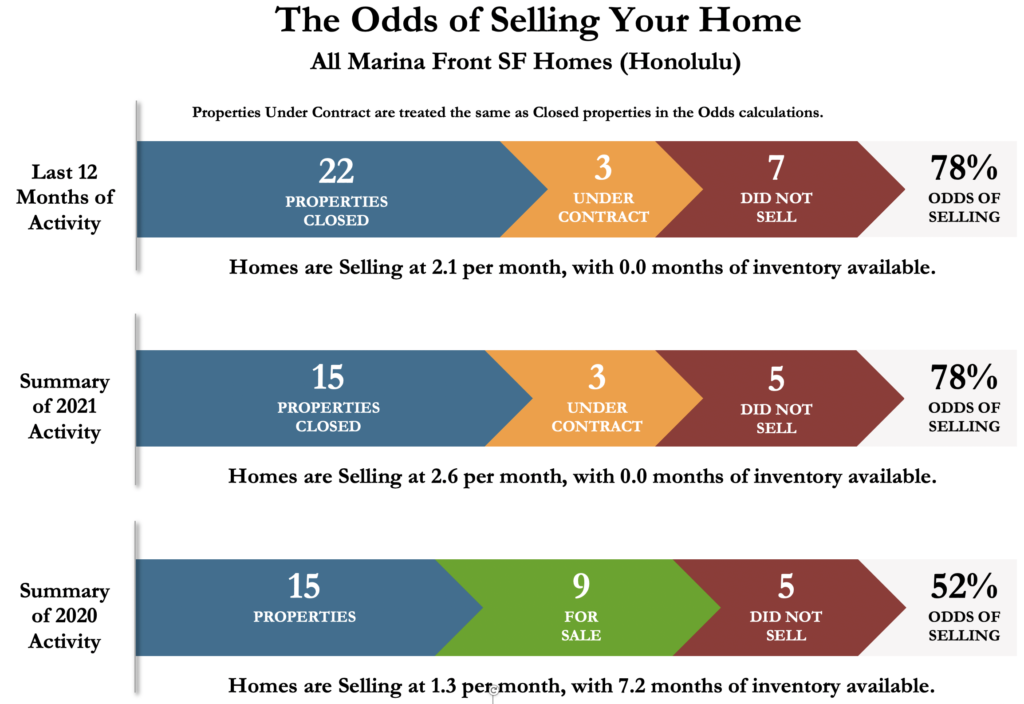
In this chart, we can see the “Odds of Selling Your Home.” It is based on the last 2 years for all Single Family Marina Front homes in Hawaii Kai. We can see that in 2020, there were 15 properties sold (blue), 9 active listings at the end of the year (green) and 5 homes that did not sell (red). In 2020, there was a 52% odds of selling. In 2020, 1.3 homes were selling per month and there was 7.2 months of inventory.
In 2021, so far, there have already been 15 properties sold (blue), 3 homes in escrow (orange) and again 5 homes that have not sold. The odds of selling have gone up to 78% and twice as many homes are selling per month, at 2.6. There are currently no marina front homes for sale.
average time to close
108 to 86 days to close in 2020
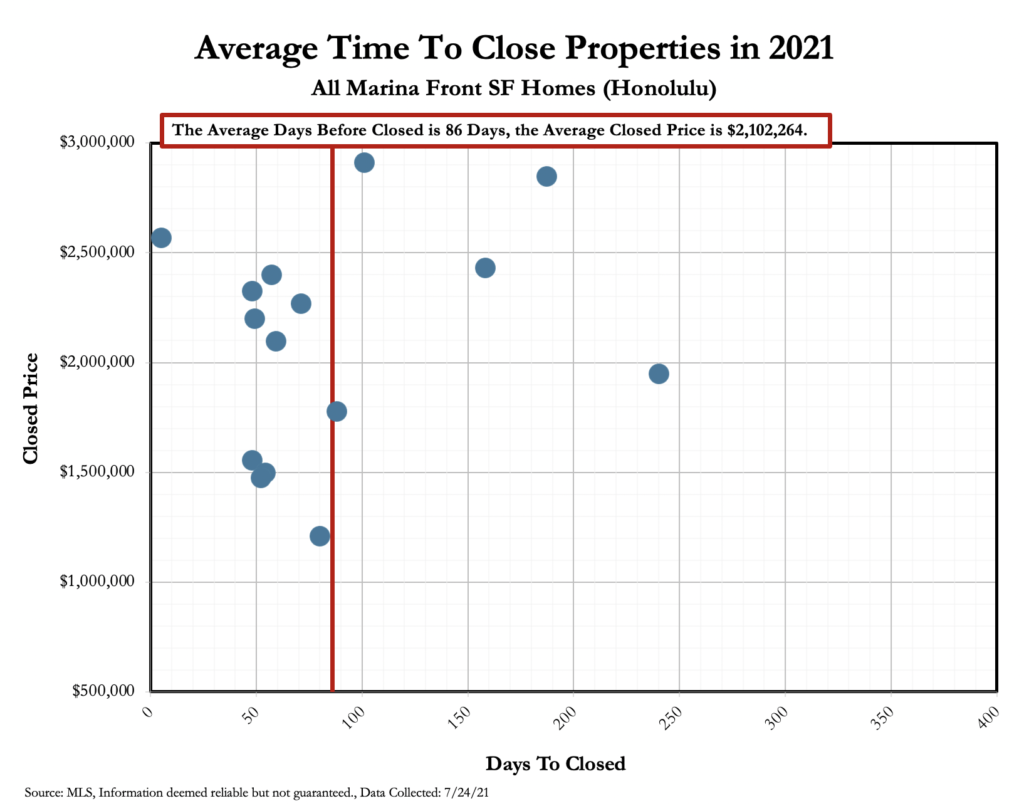
Each dot below, represents one closing in 2021. From listing date until closing, it has taken 86 days, on average, to sell units in 2021. It took 22 more days in 2020. Average sales price is up nearly $600k in 2021 to $2.1M from $1.5M in 2020.
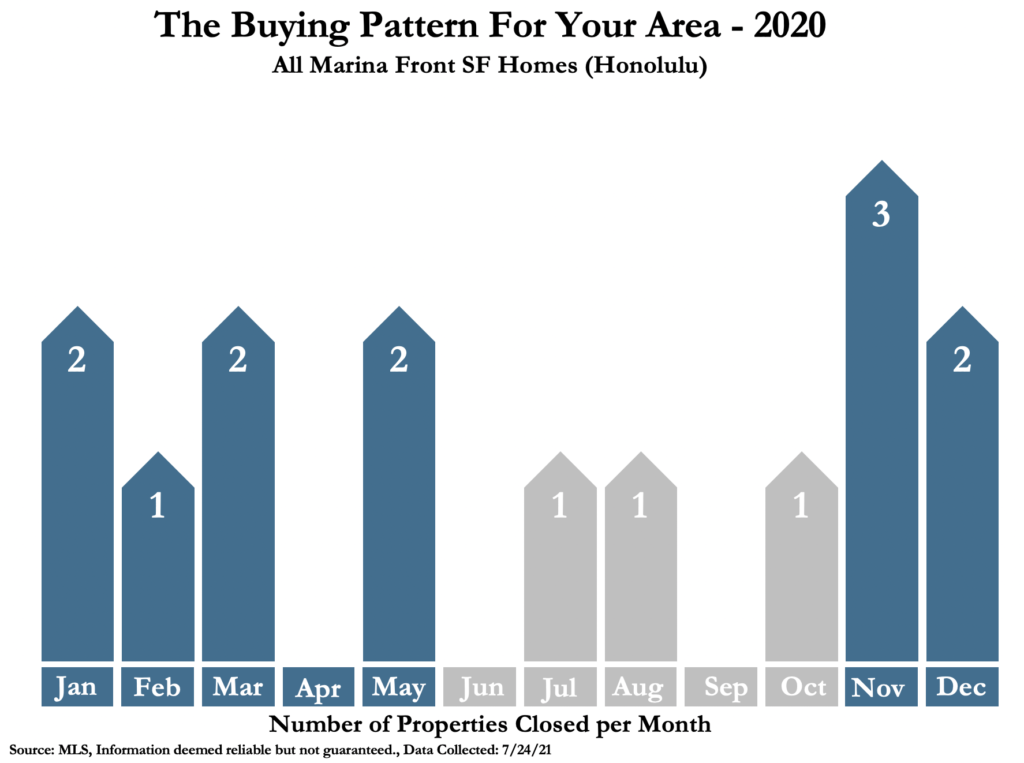
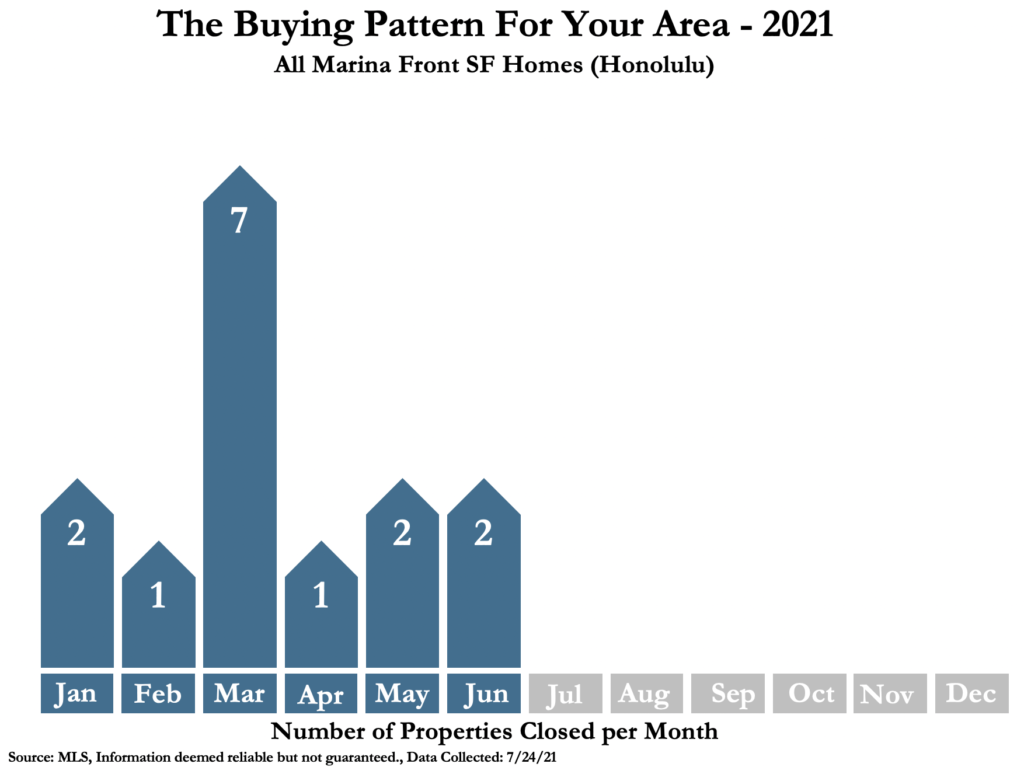
BUying patterns
Pandemic pause in 2020 closings
We can see the drop off in closings in summer 2020, following the shutdowns. 4th quarter typically accounts for 10% of the closings, in a normal year, but in 2020 it was about 50% of the activity. This activity carried straight over into 2021…
2021 is showing strong activity and no signs of stopping.
Real Estate pond
Currently on active listings
The pond chart, shows us the past 90 days of activity for all Marina Front property. There have been 3 new Marina Front properties that have come on the market. There are currently no active listings, 3 properties in escrow and 4 homes have sold.
Above and below, you can see the past 3 years of just Spinnaker Isle activity. The above chart, demonstrates price/SF and the difference between asking and sales price.